Benjamin LeRoy
Email: benjaminpeterleroy [at] gmail [dot] com

Benjamin LeRoy
Email: benjaminpeterleroy [at] gmail [dot] com
Email: benjaminpeterleroy [at] gmail [dot] com
Email: benjaminpeterleroy [at] gmail [dot] com
I'm currently a Lead (Founding) Data Scientist at Nudge and Level Labs, working on 3d human and clothing modeling.
Before that, I was at Nike in Product Supply Chain as a Senior Data Scientist working on discrete optimization and predictive modeling problems building supply planning solutions, measure better outcomes for risk measurement, rapidly prototype tools for changing duty scenarios.
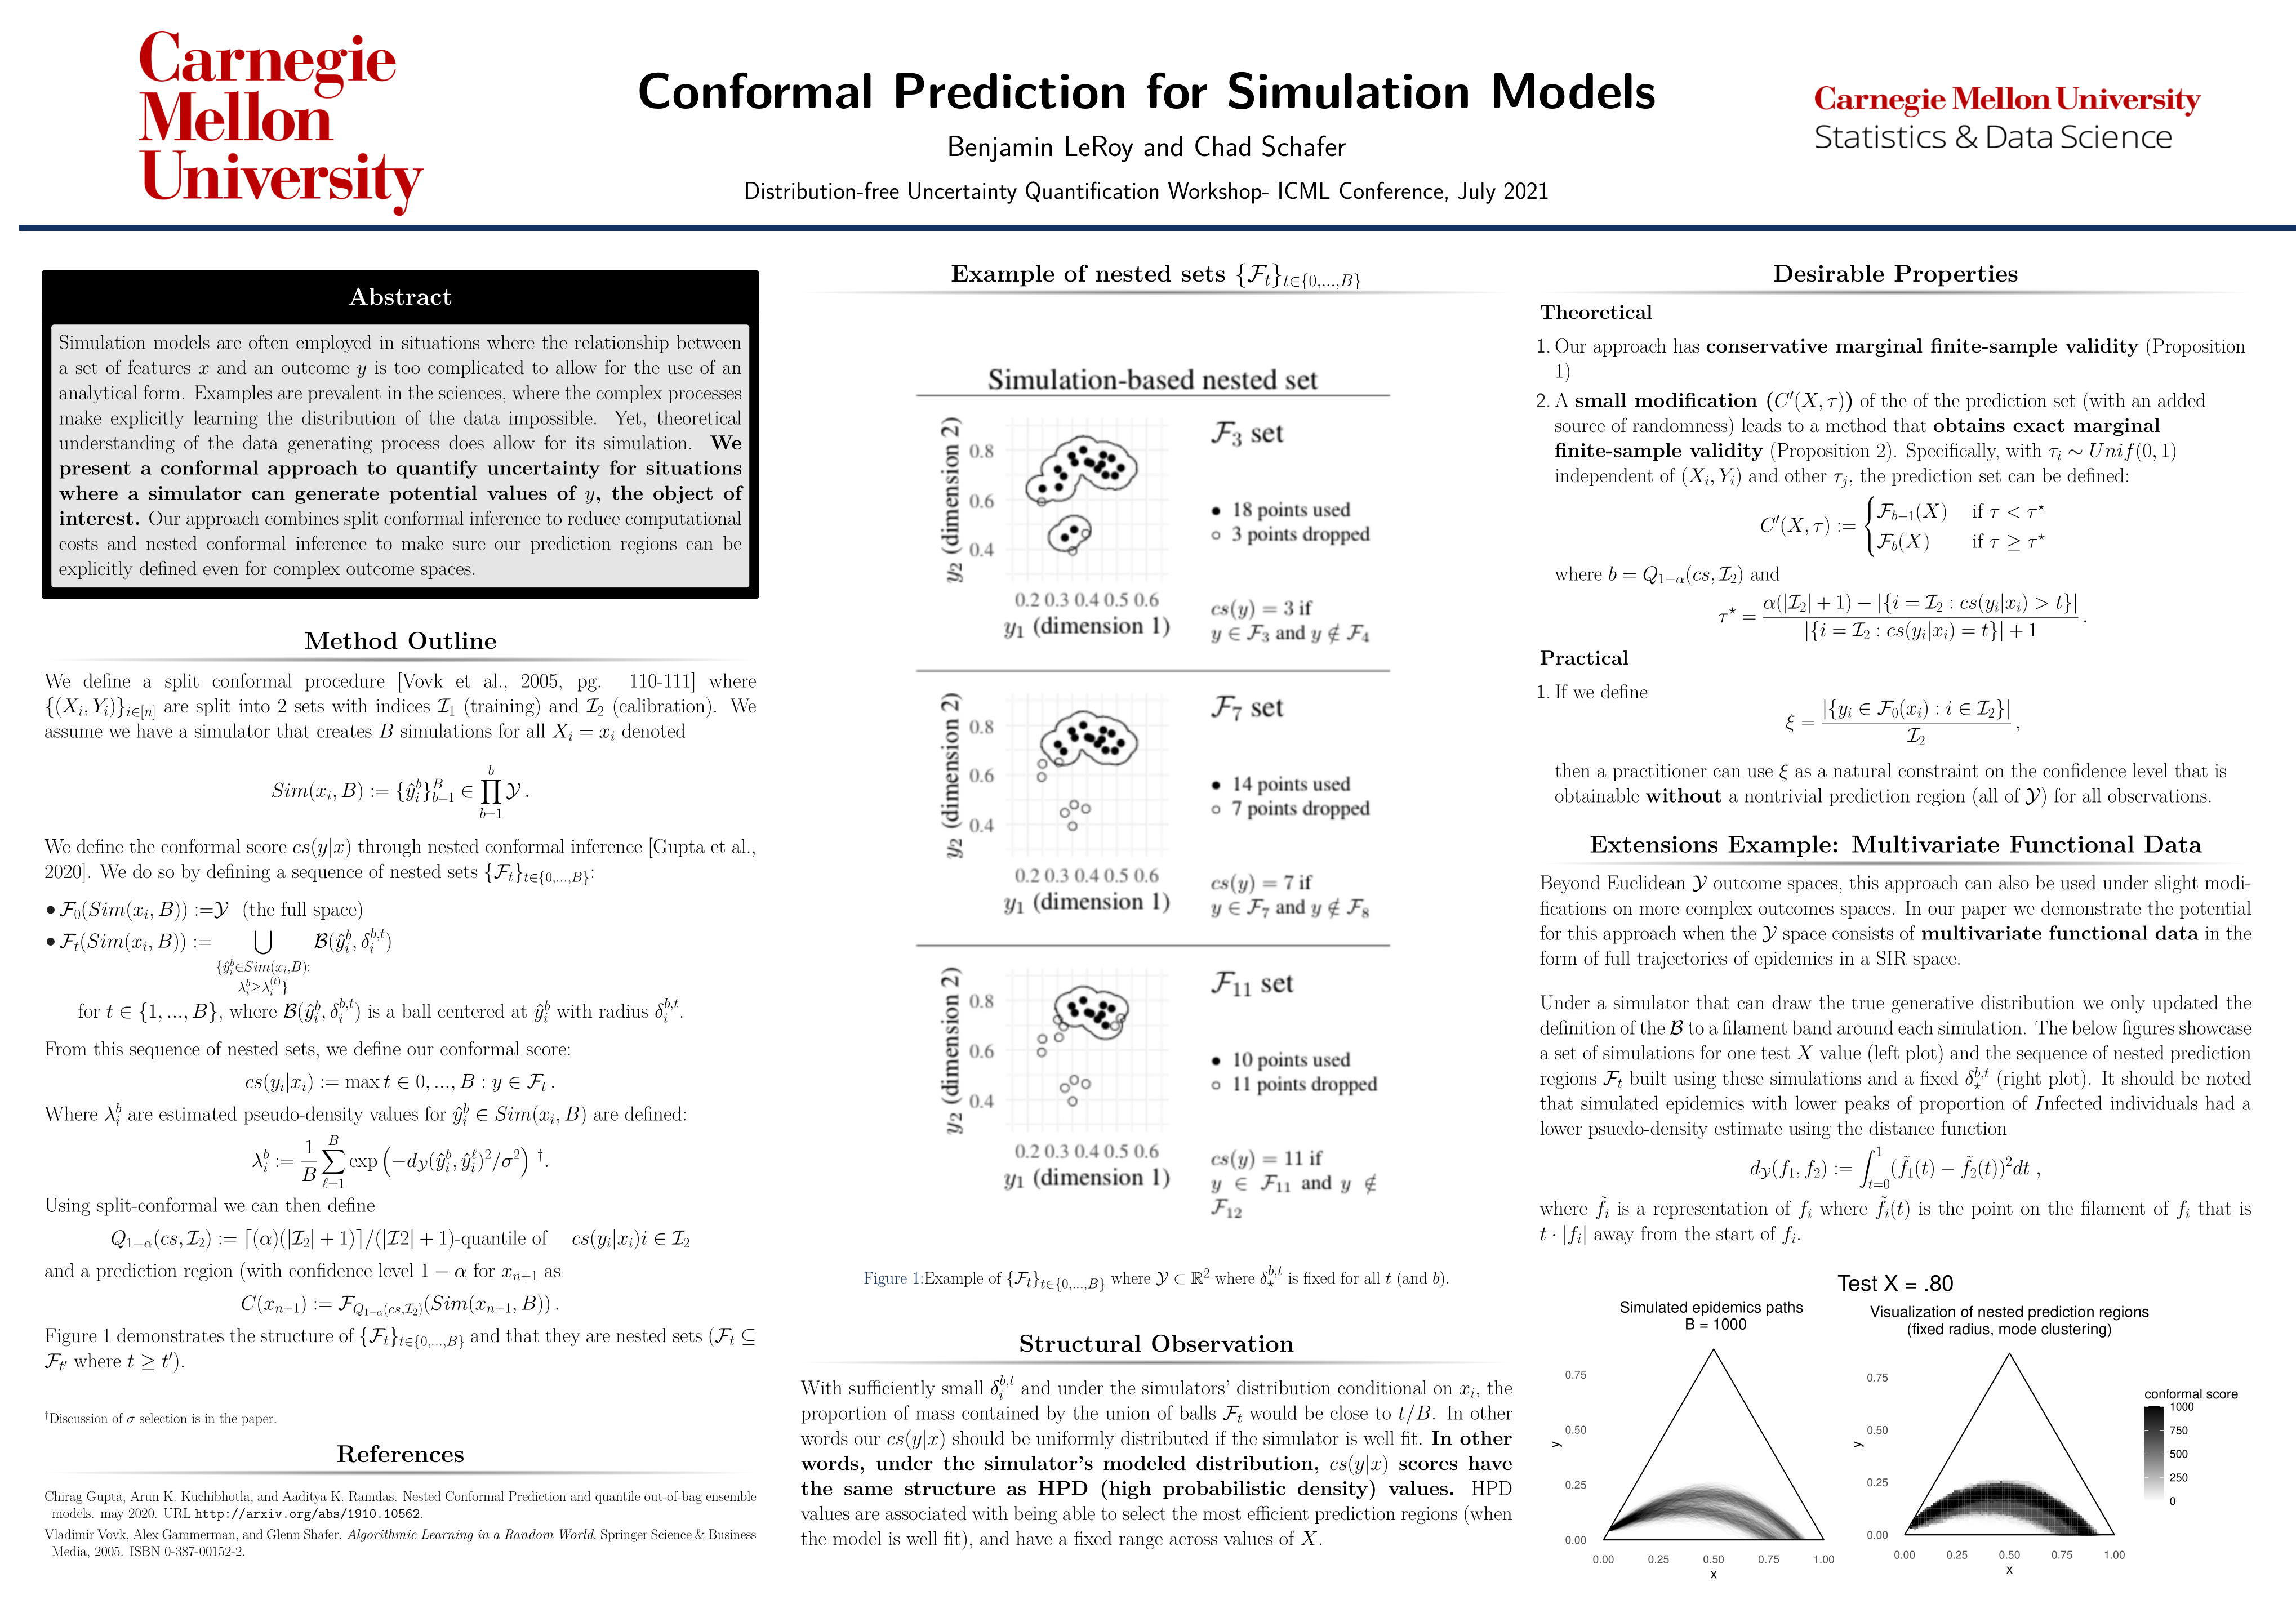
I received my Ph.D. from the Statistics and Data Science Department at Carnegie Mellon University in December 2021 under the supervision of Professor Chad Schafer. My thesis focused on simulator-enabled conformal prediction. As a graduate student, my research interests broadly reflected interests in quantifying uncertainty within applications of machine learning, leveraging optimization to solve novel statistic problems, capturing complex trends with smart data visualization, and more.
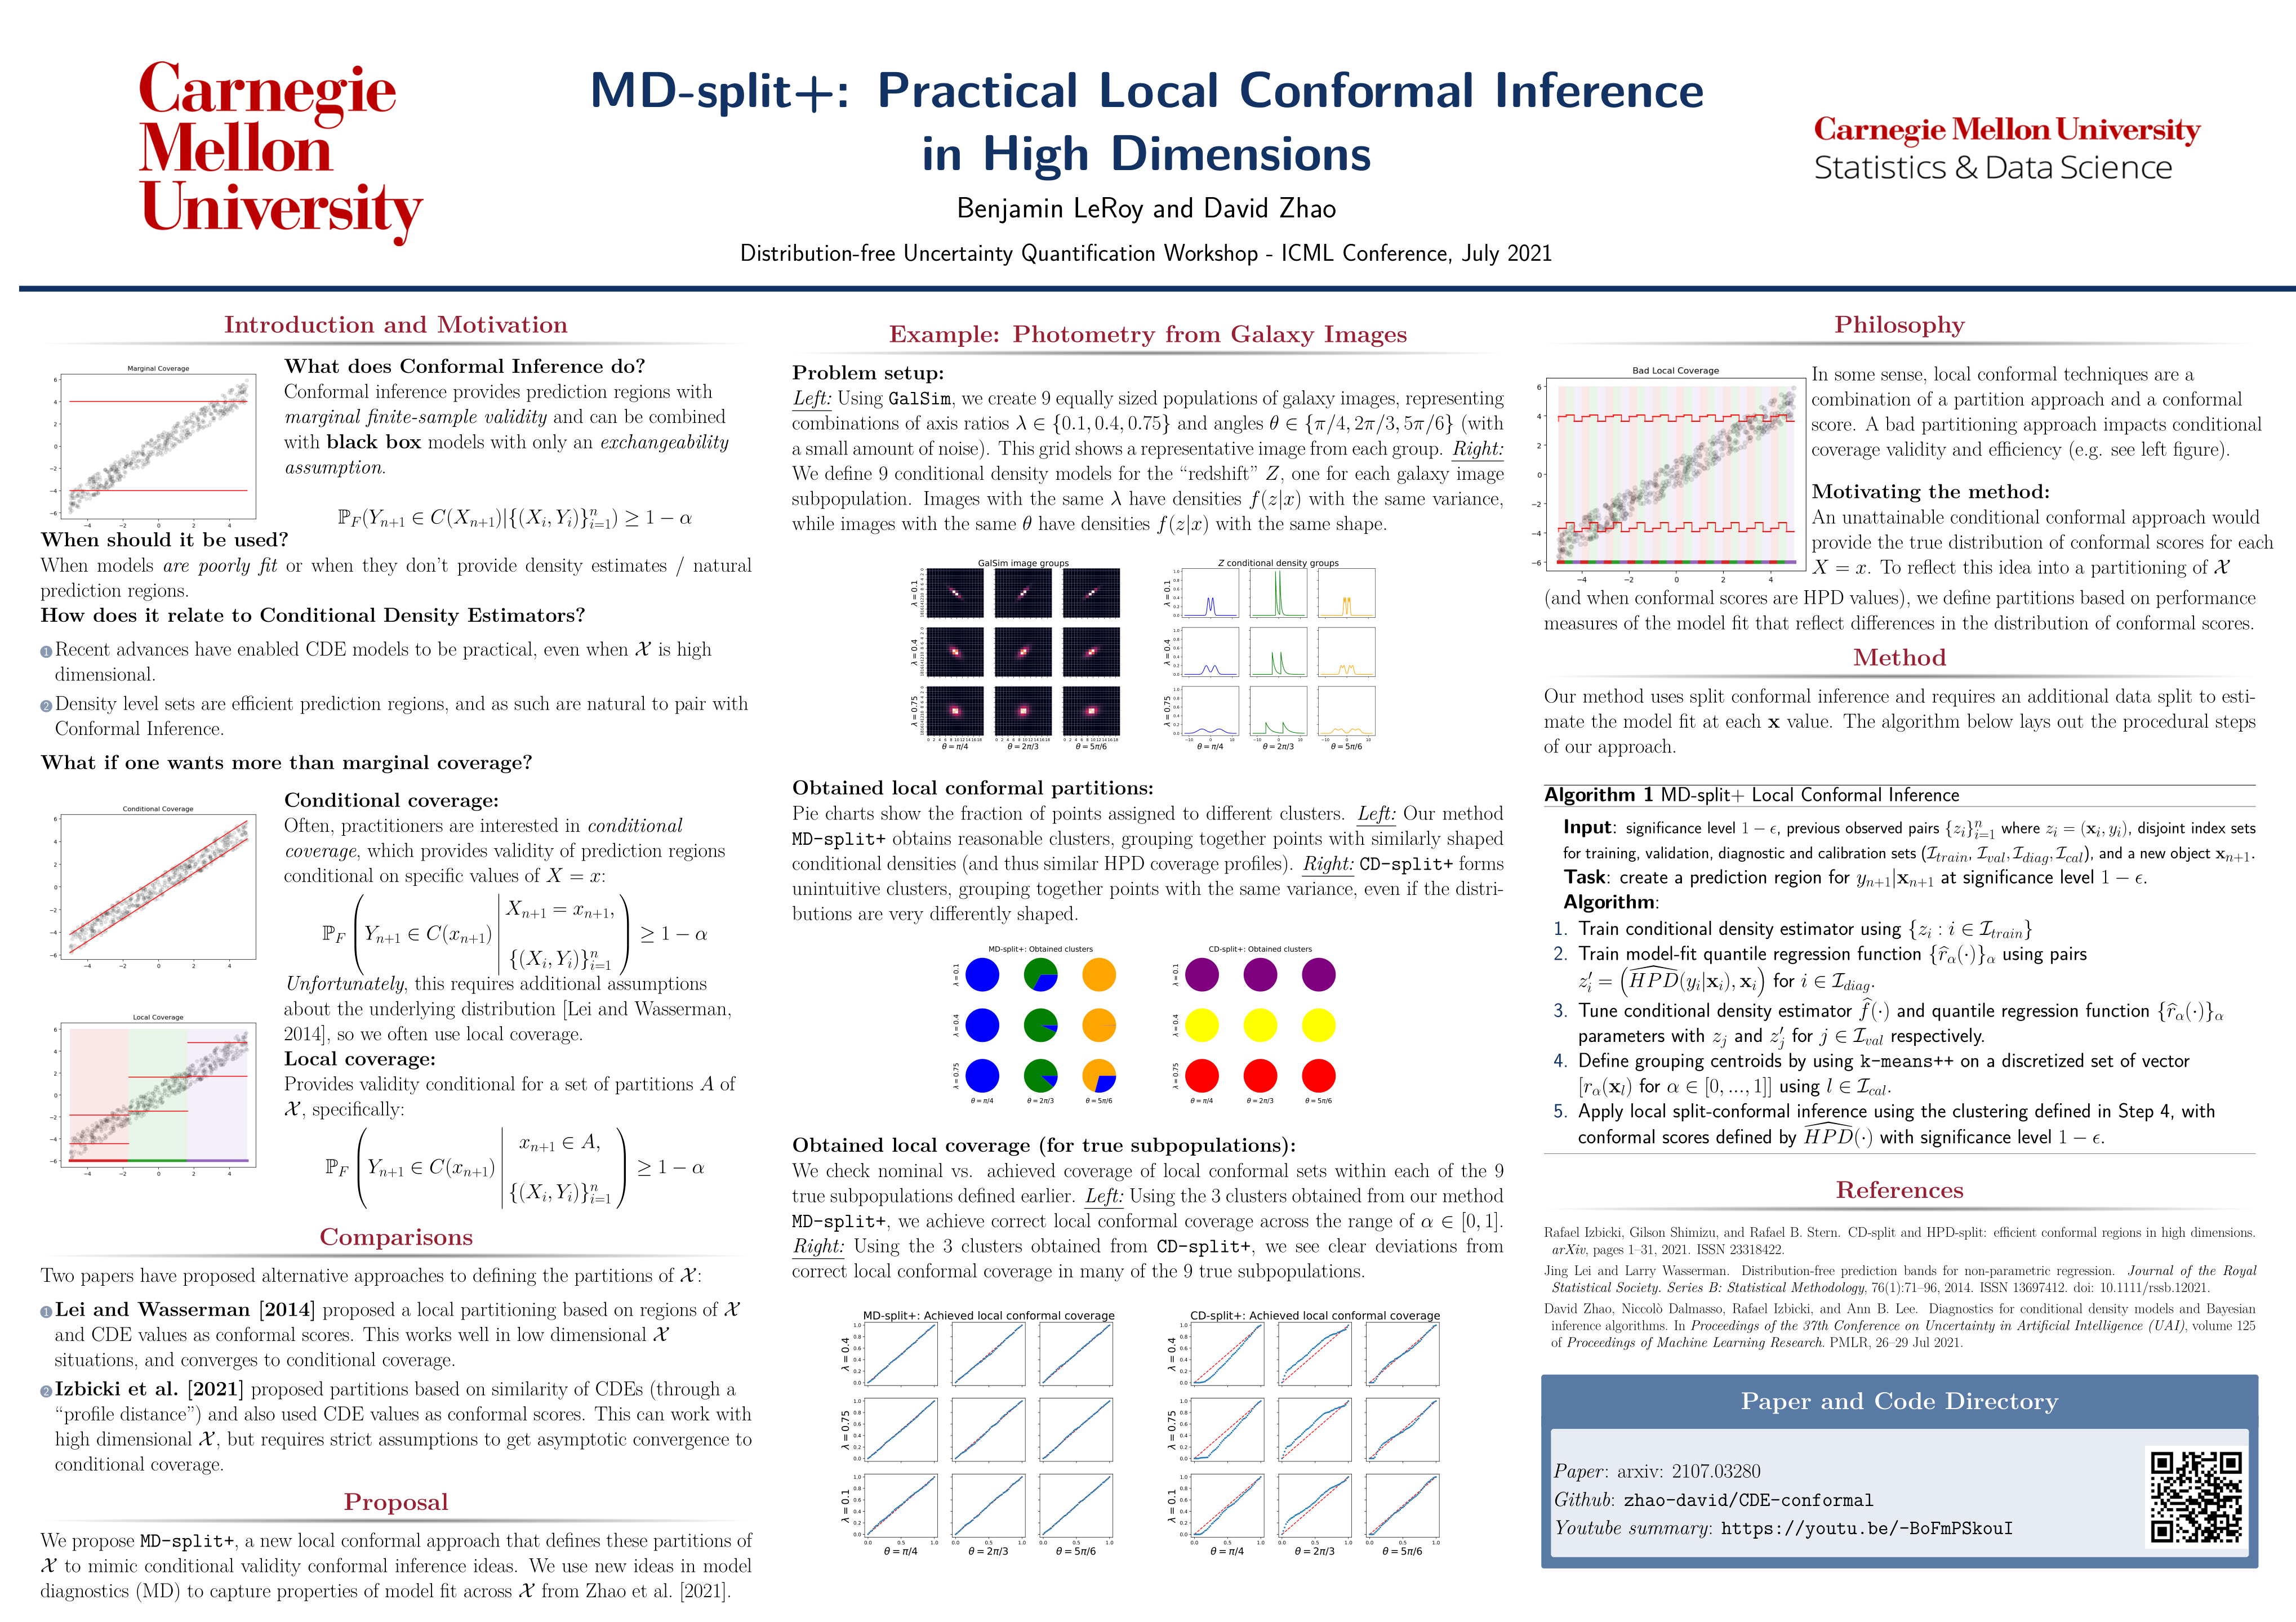
MD-split+: Practical Local Conformal Inference in High Dimensions, MD-split+: Practical Local Conformal Inference in High Dimensions, 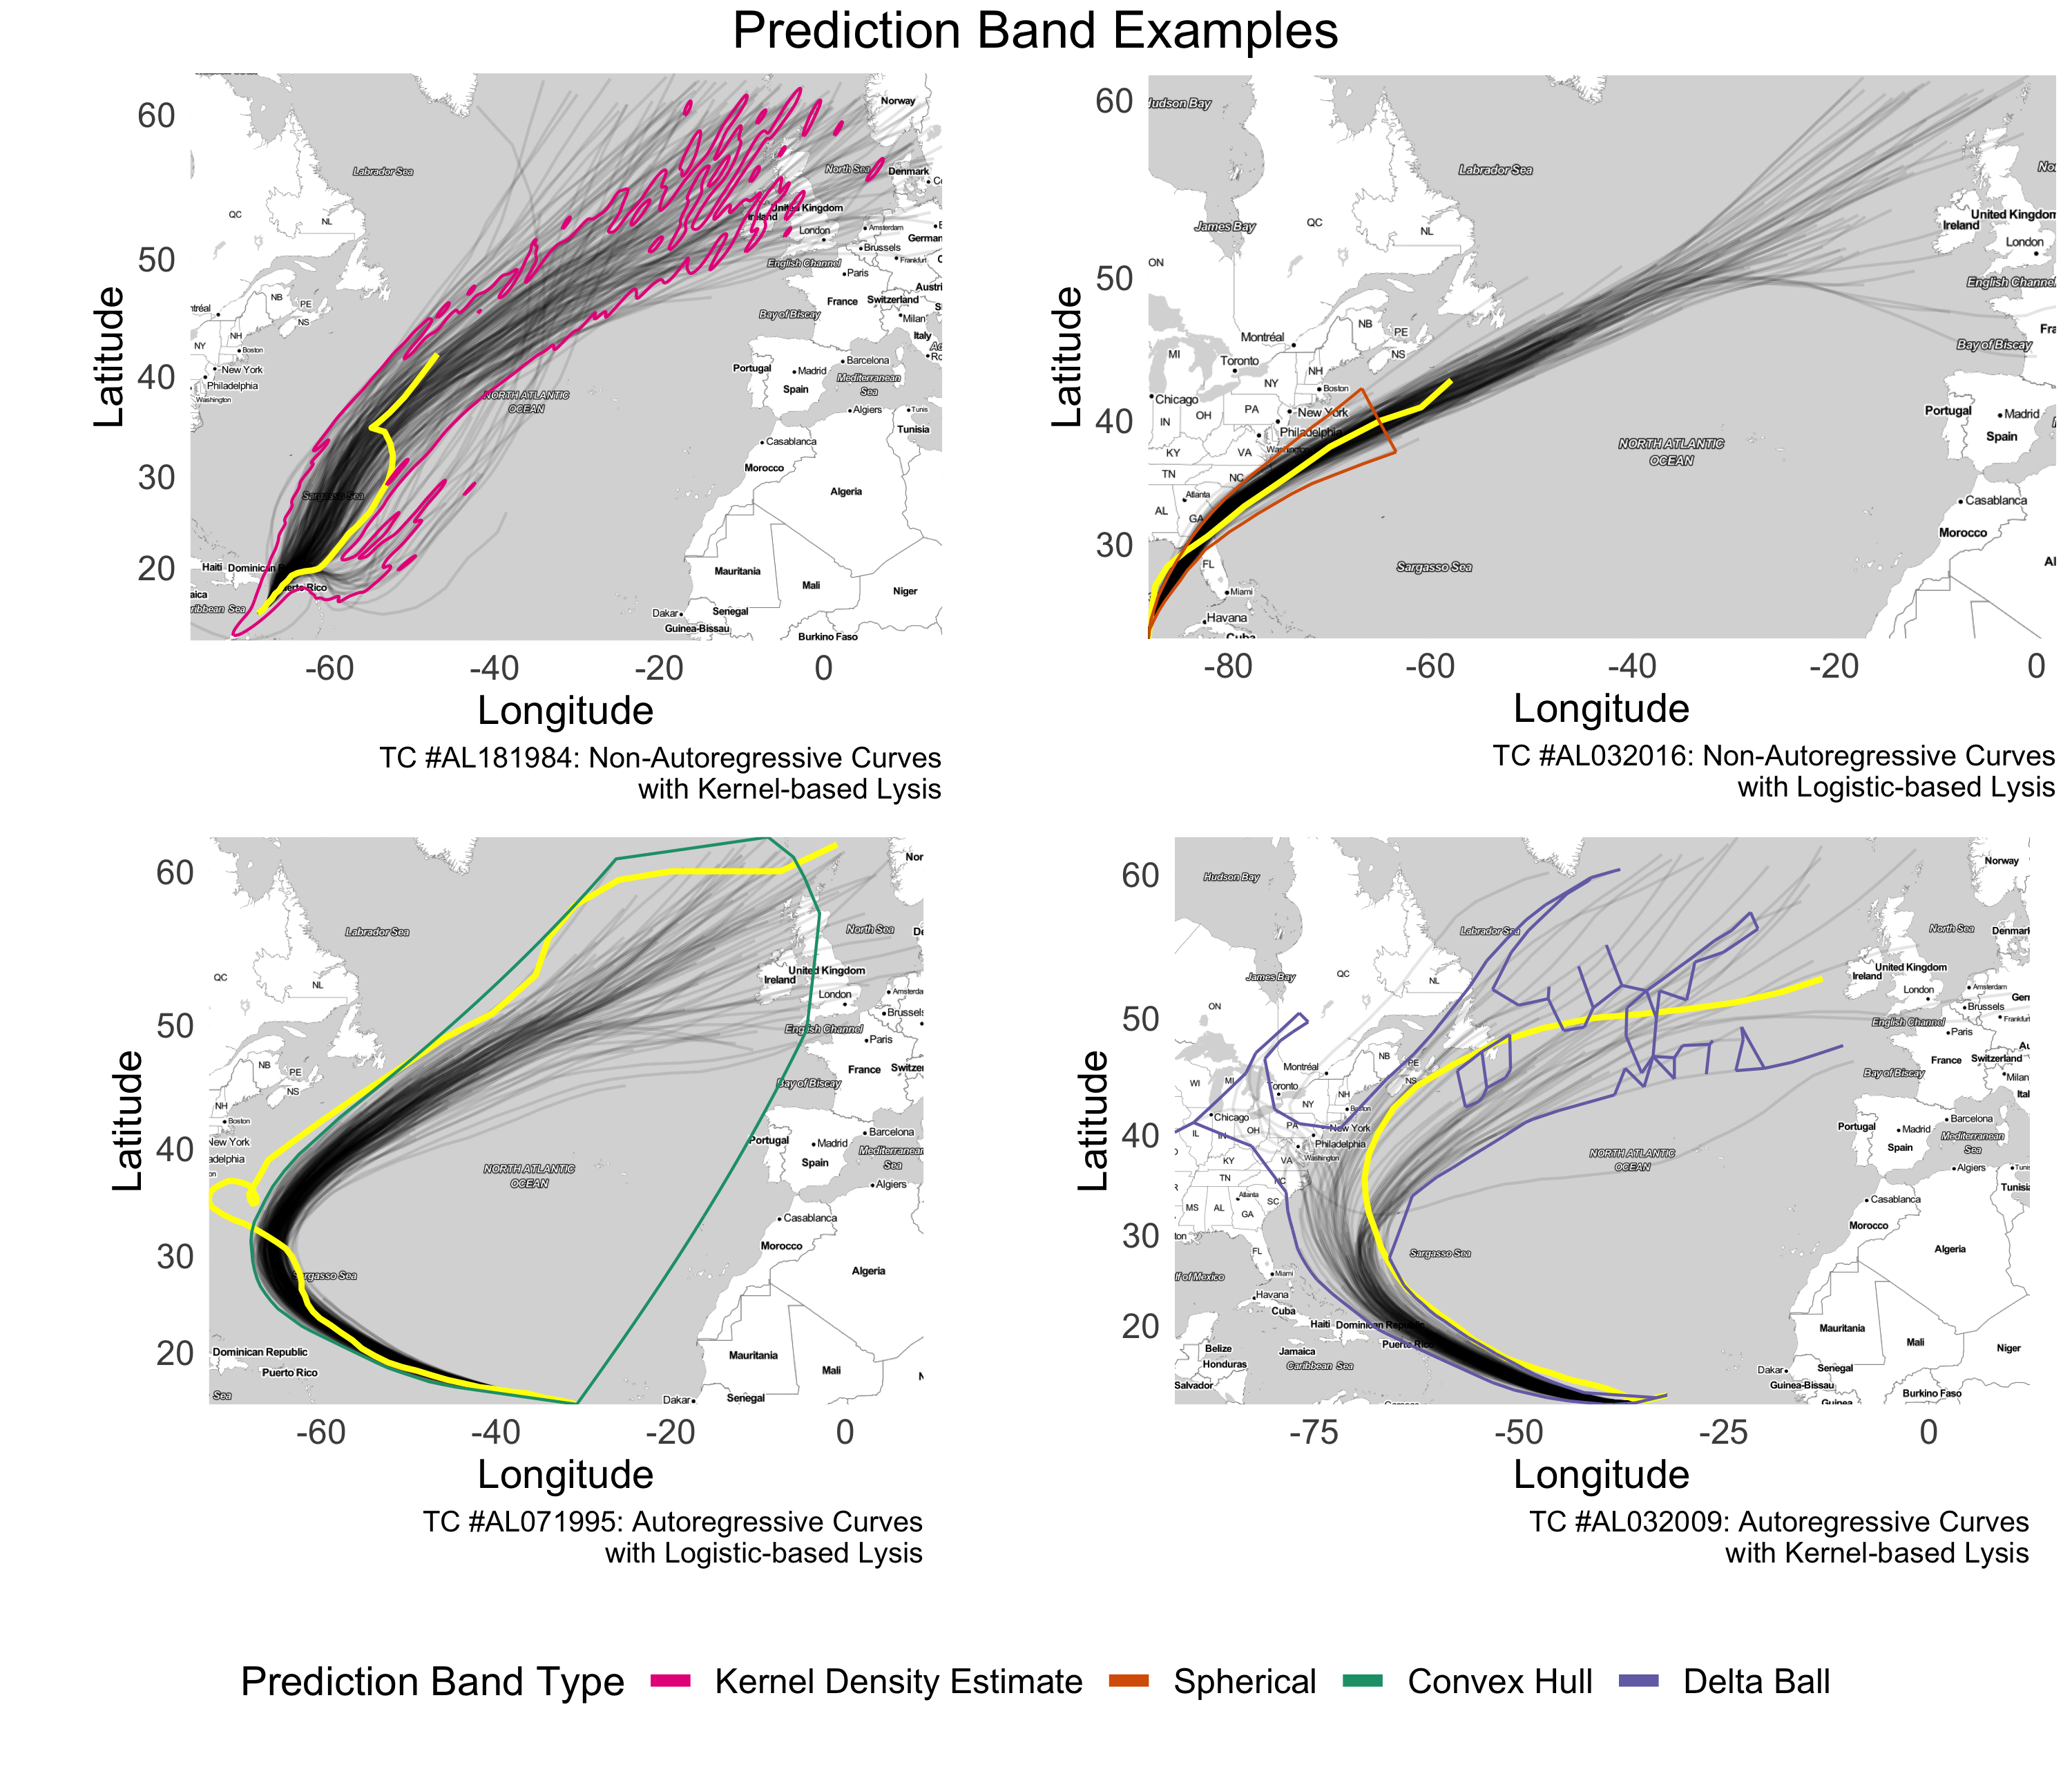
R package: TCpredictionbands.
R package: TCpredictionbands.

cowpatch (python Package)cowpatch brings plot aggregation like seen in R packages like cowplot, gridExtra and patchwork to python, specifically relative to the ggplot implimentation in plotnine. This package internally leverages svg objects to provide a flexibible but powerful framework to accomplish it's goals.
python package on github.
EpiCompare (R Package)EpiCompare is to provide the epidemiology community with easy-to-use tools to encourage comparing and assessing epidemics and epidemiology models in a "Time-Free" manner. This package provides the user the ability to compare epidemics and epidemiology models types (across both the "Agent"/"Aggregate" paradigm and the specifical models). All tools attempt to adhere to tidyverse/ggplot2 style to enhance easy of use.
R package on github.
MD-split+: Practical Local Conformal Inference in High Dimensions (paper: paper-arxiv, youtube summary: 15 min) tidyverse style coding (ggplot2, dplyr, tidyr, ...), (3) introduced high level computing concepts like object oriented programming and how to make packages in R, (4) provided high level overviews of the `split-apply-combined' paradigm, parallel computing and deep learning in R.
ggplot2) and visualization theory.
R to python.